Understanding India’s Exports — The Basics
India’s Exports — The Arrival of New Data
Export statistics in India was primarily reported at the national level, and in some cases at the state level (based on the origin of exports). Information on the export contributions of each district was largely unavailable. This was a major gap which severely affected our ability to understand the local (district-level) factors that enable the growth and sustenance of export hubs.
With the increasing importance given to expanding the scale of exports in India, there is a need to to capture data at a more granular level. This will aid in devising targeted policies and incentives specific to the local characteristics.
The Central Board of Indirect Taxes and Customs has recognised the importance of capturing information at the granular level, and has hence started collecting data on the value of exports based on the district of origin. District level data from January 2021 is publicly available on the Ministry of Commerce’s website. This is indeed a welcome move as understanding the local dynamics would greatly help policy makers in crafting targeted policies that take into account local realities.
India’s Export Landscape
I leverage the newly available district-level export data from January 2021 to June 2021, to map the distribution in the value of exports across India’s districts (Figure 1). A substantial portion of export contributions come from districts in Gujarat, Maharashtra, Andhra Pradesh, Odisha and Tamil Nadu.

Jamnagar (Gujarat), Mumbai Suburban (Maharashtra), Surat (Gujarat), East Godavari (Andhra Pradesh), and Devbhumi Dwarka (Gujarat) are the top five districts in terms of export contributions.
Jamnagar and Devbhumi Dwarka specialise in refined petroleum products such as automotive fuel, Mumbai Suburban and Surat specialise in diamond exports, and East Godavari district specialises in exporting small vessels and off-shore machinery such as light vessels, fire-floats, floating cranes and other vessels.
Using information on the size of the workforce (defined as those that are employed or seeking employment) for each district, I also map out the workforce adjusted export numbers. The data on workforce size is derived from the unit-level data of the Periodic Labour Force Survey 2019–2020 (PLFS).

Tamil Nadu and Gujarat — A Closer Look
I take a closer look at two states, namely, Tamil Nadu and Gujarat. I chose Gujarat as it is the state with the highest exports between January and June 2021. The reason for choosing Tamil Nadu is personal of course, it being my home state.
Tamil Nadu — A quick survey


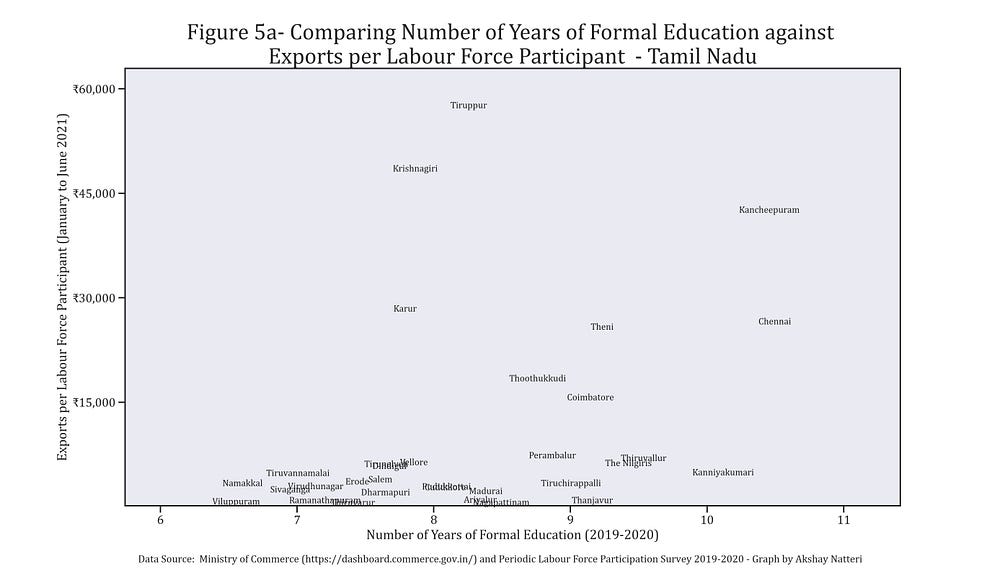
Thiruppur, Krishnagiri, and Kancheepuram districts are the leading districts in terms of total export value. Thiruppur is a global textile products hub (specifically t-shirts and knitwear), Krishnagiri specializes in the export of two-wheelers and allied products, while Kancheepuram is home to several leading automobile sector manufacturers and exporters. When adjusting for the size of the labour force, Karur joins the league of top performers. Karur specializes in the export of cotton products such as towels and bedding articles.
Moving to Gujarat


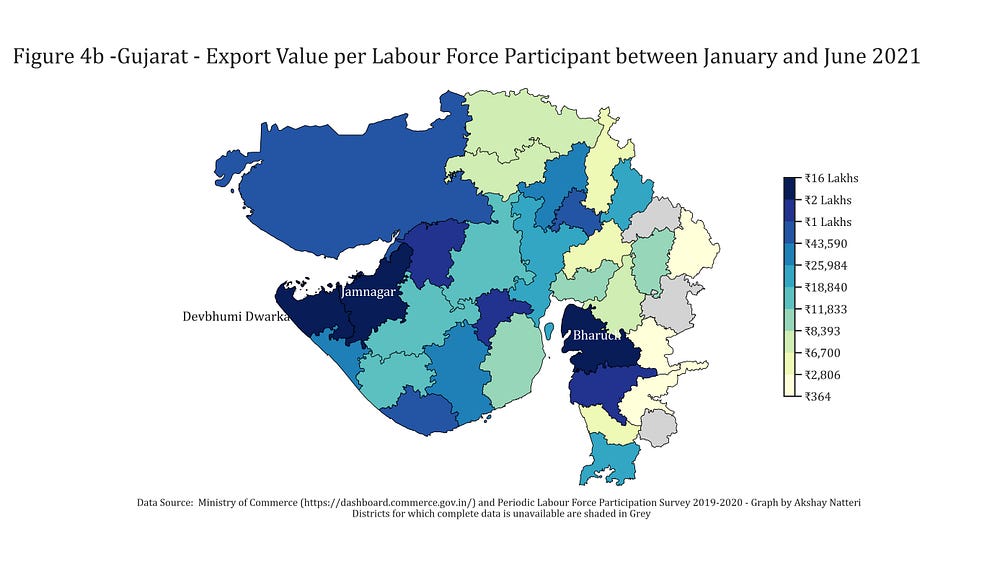
Apart from Jamnagar, Dwarka, and Surat, Bharuch is also a leading exporting district specialising in the export of refined copper cathodes. The scale of exports in the Gujarat region is truly staggering, with the high-export districts having well over ₹2 lakh worth of exports per workforce participant.
Comparing the Export Performance with Some Characteristics of the State
Using data from the PLFS, I compare some characteristics of the districts in Tamil Nadu and Gujarat with their export contributions. The characteristics are, (1) average number of years of formal education of the workforce,(2) average monthly household consumer expenditure, and (3) proportion of self-employment in the workforce.
Please note that the representation is not to show ‘correlations’ or the impact of each of the factors on export contributions. The graphs do not provide sufficient information to make such conclusions as there are a number of other factors which may affect the outcome. For example, a district may have a very highly educated workforce, but a number of other factors such as the location of the district, access to resources, and cost of production could affect its export values. In order to ensure the results are not affected by other determinants, one would need to hold all the other factors constant. If not, the conclusions could be very wrong. Hence, it would be incorrect to draw conclusions about the importance of the factor based on these simple plots. The plots only serve to provide an approachable visual depiction of the characteristics of districts .
Tamil Nadu — Prominence of Grassroot Entrepreneurship in Theni, Karur, and Krishnagiri?


Krishnagiri, Karur, and Theni are three districts where one could focus. The three districts (despite their relatively modest educational and economic position) have a very high level of self-employment (i.e. employment that is neither salaried nor casual labour). This could potentially be a sign of grassroots entrepreneurship, which needs to be further strengthened and nourished.
Gujarat — Prominence of Self-Employment


In Gujarat, 10 out of the 30 districts for which data is available report self-employment rates of over 65%. This includes districts such as Dwarka, Morbi (very well known for its ceramic tiles exports) and Batod that also contribute a substantial amount of exports. The understanding of how grassroot entrepreneurship impacts macro-economic success is not fully understood in India, and certainly a topic for further enquiry, with Gujarat being a prime example.
The Takeaway — Qualitatively Speaking
From the analysis, districts with high levels of export contribution could be qualitatively categorized into two groups. The first kind are districts where the export is primarily driven by large multi-national companies, like in the case of Jamnagar (home to Reliance Industries) and Kancheepuram (home to Hyundai, Daimler, BMW, and Renault-Nissan). The second are more grassroots driven export hubs such as Morbi, Bharuch, Batod, Karur, Theni, and Krishnagiri.
MNC investments typically require a highly qualified workforce and are based close to relatively prosperous districts. The grassroots entrepreneurship often happens in districts that are relatively less prosperous and where the workforce is not highly educated.
While grand government policies often target the large scale MNC investments, very little is known or done for the grassroots (at least historically). There is a need to identify and provide targeted incentives to export hubs that are driven by grassroots entrepreneurship (like Karur, Morbi and Theni). This could include initiatives such as expanding access to formal credit, improving the overall infrastructure, and providing assistance for expanding their trade network.
The analysis presented here is only the tip of the iceberg, with more data over the years, we would be able to better understand the dynamics and distribution of exports in India at the district level. We would also be able to use more sophisticated quantitative techniques to identify grassroots driven export hubs. This would enable the development of targeted policies to promote trade and further the economic development of the districts.
The shapefiles used for the maps in this article are from Devakumar KP (https://www.kaggle.com/imdevskp/india-district-wise-shape-files).
Note: Data for only the top 3 products exported by each district were available at the time. This was used for the analysis. The data availability has substantially improved since. District totals for each district, and the top 10 products are available now.
Author of Article: Akshay Natteri Mangadu
